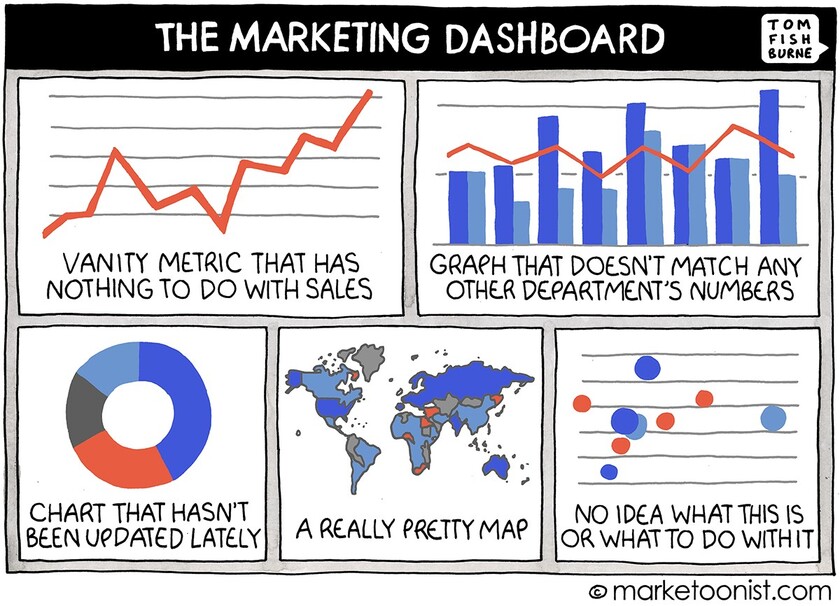
Tracking business success is hard. Really hard. Using key performance indicators (KPIs) to track success is common, but too often, the indicators are incorrectly implemented and offer little or no insight as to how that goal was achieved—or not.
A KPI is a calculated metric showing progress of a critical action or activity.
KPIs are not numbers found in reports. Instead, they are calculated values which are described as ratios, percentages, rates, or averages. And they should be measured over time.
Poorly chosen and frequently misused, KPIs are often useless numbers that nobody understands. Mostly, they tell you what happened but, if properly identified should tell you why. For KPIs to be useful they should be actionable numbers that immediately show performance levels and what activities can be taken to affect positive change.
KPI development
As an example, let’s look at revenue, something that is monitored by every business. While important to track, of course, revenue is not a key performance indicator. The amount of revenue—good or bad—is the result of many factors. You can’t just look at the number and know what to do. For that, you must drill down further into the activities and processes that cause the revenue to change. Those are the valuable and meaningful key performance indicators.
Key performance indicators should require little or no interpretation. You should be able to look at the number and immediately know how things are going.
The 6 KPI Essentials
1. Use metrics, not measures.
And there is a difference. Measures are values found in reports that, on their own, aren’t very insightful. Instead, KPIs should be calculated values from measures that are described as ratios, percentages, rates or averages. And they should be evaluated over time.
For example, instead of using the number of customers or website inquiries as KPIs, you might use the percentage increase in customers or the ratio of visitor inquiries to total visitors month over month.
2. Track granular actions and activities rather than aggregate values.
Setting personal, departmental or corporate goals is fundamental to most people, but measuring how we perform against those values is just not enough.
Measuring high-level results such as revenue or the number of customers is a mistake because it doesn’t tell you how you got there and what should be done next. To know that, we need to evaluate the events that caused those results.
Certainly, we can conclude that if revenue increased and we met our goal, that’s a good thing. But we don’t know what caused it. Was it improved customer retention? Higher conversion rates, better margins or more affiliate partners? Was it an increase in the number of sales people, the opening of new markets or new product launches?
Only by identifying the actions or activities that are associated with that goal are you able to gain the insight you need to affect positive change.
3. Select KPIs based on your goals, nothing else.
Don’t fall into the trap of picking KPIs because others are using them or because they are on a list of popular KPIs. Your key performance indicators must be consistent with your particular needs—and they must always be driven by your business goals
4. KPIs must contain specific actions and be monitored frequently.
If KPIs don’t contain specific actions, it’s difficult to tell what needs to be changed, boosted or, sometimes, even stopped. Frequent monitoring allows you to make changes—improvements—sooner.
5. Share your KPIs enterprise-wide.
Sharing KPIs throughout the organization gets everyone engaged in the process. Mapping them out is also key as it shows all team members what activities people are working on and how their work affects the overall goals for the company. Knowing everyone else’s KPIs is also motivational if for no other reason than peer pressure. It also encourages employees to take the initiative, creates competitiveness and gives everyone a sense of pride in their accomplishments.
6. Systematically determine actionable metrics
To explain this, let’s look at an example: Say you want to increase revenues (who doesn’t?). Perhaps you believe that to do that, you must write five blog posts per week.
Wrong approach.
Only by drilling down systematically from your goal of raising revenues will you come up with KPIs that are useful and give you the insight you need to achieve that goal.
Here’s the process as it should be: To increase revenues, you need to attract more (specifically defined) customers, say engineers in North America. To do that. you may decide it’s a good idea to show thought leadership. One way to accomplish that may be to blog regularly. For that, you set a target of five posts per month—or, better yet, a 20% increase in blog postings per quarter. You might also add a KPI to monitor how engaged your customers are with your blog posts by tracking comments people leave and how that improves—expressed by ratios, percentages, rates or averages—over time.
Now, you have actionable—and useful—metrics that are consistent with corporate goals.
When properly set up, KPIs deliver exceptional insight into how business is performing and what to do to affect change. If they are ill-conceived, you may be relying on faulty values which may cause more harm than good.
KPI Karta can help
KPI Karta helps you design actionable metrics and puts them all in one, easy-to-understand, cloud-based and interactive graphic illustration. With all your key performance indicators (KPIs) in one place, you can see how they relate to each other and how they are connected to your organizational goals.
The biggest benefits? First, our 7-step process ensures that actionable KPIs are produced. As well, because the illustration is color-coded, you can see, at a glance, exactly where you are meeting your objectives and, more importantly, where you are not – so you can make adjustments RIGHT NOW.
KPI Karta will soon be available to businesses everywhere as a service
Get added to our mailing list and be notified when the service is available. info@kpikarta.com


